



Website Traffic-to-Lead Rate: Small Business Guide
Small Business Marketing
More traffic does not always mean more leads. If I get 1,000 visitors and convert 5%, that can beat 5,000 visitors at 0.5%.
Here’s the main point: I should track only high-intent actions, use one simple formula, set a 30- to 90-day baseline, and review results every month. That gives me a clear view of whether my site is turning visits into sales conversations.
In plain terms, this guide shows me how to:
pick which actions count as leads
ignore low-intent actions that pad the numbers
calculate traffic-to-lead rate with a simple formula
compare results across the same date range
spot whether forms, calls, quotes, or bookings are going up or down
The core formula is simple:
Traffic-to-lead rate = Total leads ÷ Total website visitors × 100
So if I had 2,000 visitors and 60 leads, my rate would be 3.0%. If I improved that to 100 leads from the same traffic, the rate would be 5.0%. That is 40 more leads without adding more visitors.
A few rules make the number useful:
count only completed actions
remove spam, test entries, partial forms, and abandoned bookings
use the same visitor metric each month, like users or sessions
keep U.S. formatting the same, such as 07/01/2026–07/31/2026 and $2,500
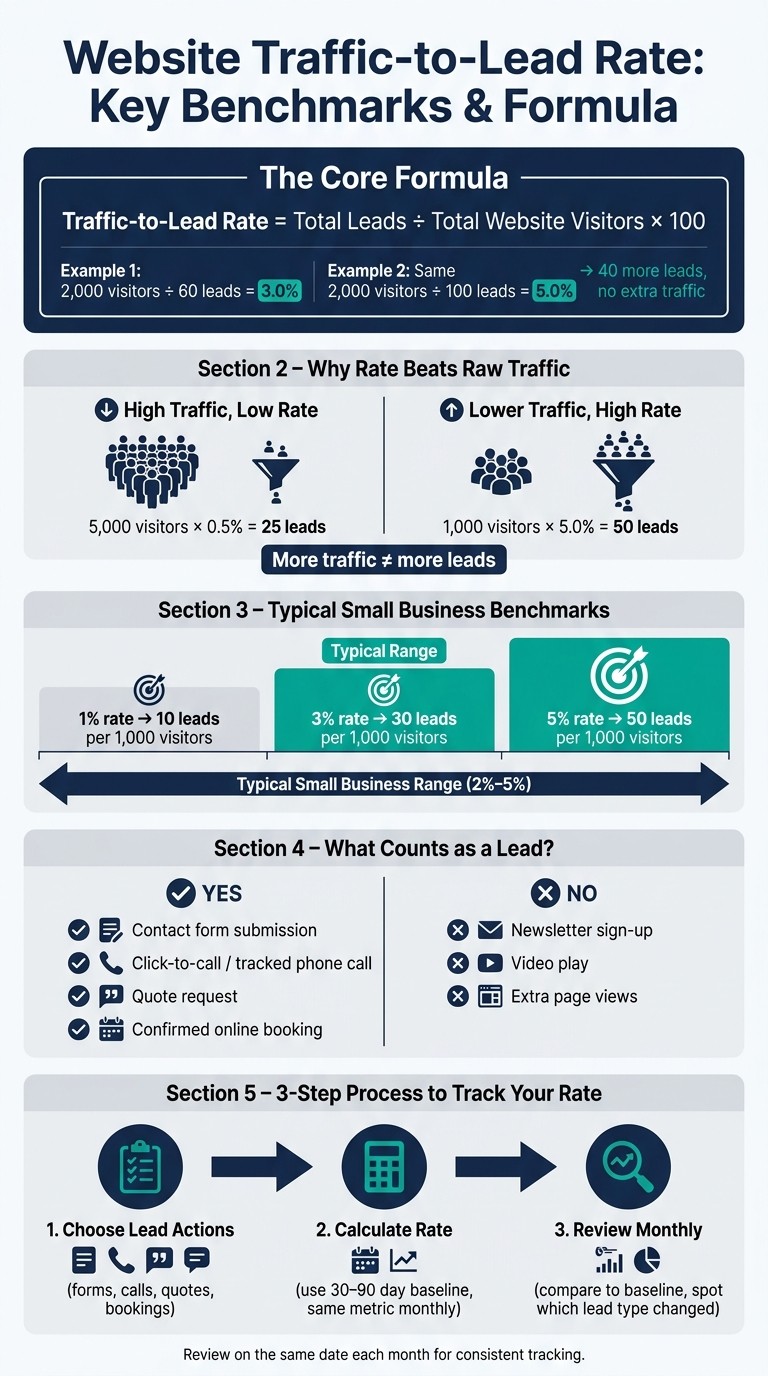
Website Traffic-to-Lead Rate: Key Benchmarks & Formula for Small Businesses
How To Optimise Your Website For Leads and Conversions (Beginner Friendly)
Quick Comparison
What to track | Count it as a lead? | Why |
|---|---|---|
Contact form submission | Yes | Starts a sales conversation |
Click-to-call or tracked phone call | Yes | Shows direct buying intent |
Quote request | Yes | Asks for pricing or service details |
Confirmed online booking | Yes | Shows clear action |
Newsletter sign-up | No | Interest, but not sales-ready |
Video play | No | Engagement only |
Extra page views | No | Not a lead action |
If I keep my lead definition steady and check the same numbers each month, I can see what is helping the site bring in more inquiries, calls, and bookings.
Step 1: Choose the Lead Actions You Will Track
Before you calculate your rate, decide which actions count as leads. Keep the list tight. For most small service businesses, two to four actions is enough.
The big rule here is simple: only count completed actions.
Once you define those actions, you can track them the same way every time and calculate your rate in the next step.
How to Count Forms, Calls, Quote Requests, and Bookings
Each lead type needs a clear moment when it becomes countable. If that point is fuzzy, your numbers get messy fast.
Lead Action | What to Count | Service-Business Example |
|---|---|---|
Contact form | Fully submitted form with required fields completed and received in your inbox or CRM | Home cleaning inquiry form with name, email, and service type |
Phone call | Tracked click-to-call or tracked call that connects and meets your minimum call duration | Tracked HVAC call from a service page |
Quote request | Completed form with enough details for an estimate | Plumbing quote form with name, contact details, service needed, and ZIP code |
Online booking | Confirmed appointment with date, time, and contact info | Salon appointment that reaches confirmed status and sends a confirmation email or text |
Skip anything that didn't fully happen. That means:
Partial forms
Abandoned bookings
Spam
Test entries
Accidental taps
Match Each Key Page to One Primary Lead Action
Give each page one main conversion goal and stick with it. If a page tries to push too many actions at once, it's harder to tell what's working.
For most service businesses, the setup is pretty simple. The homepage usually points to a contact form, which is one of several essential website elements for conversion. Service pages often drive quote requests. Booking pages should focus on confirmed appointments. And the contact page should center on either a form or a tracked call.
Pick one primary action per page and keep it steady. That makes conversion tracking much easier to read, and it makes month-to-month totals easier to compare.
Use Gatsboy Features to Capture Lead Actions in One Place

It helps to keep forms, quote requests, and bookings in one dashboard instead of piecing data together from different tools.
Gatsboy's advanced forms and Online Bookings module pull these actions into one business dashboard, with submissions and confirmed bookings logged in one place. That gives you one clear source for monthly reporting.
Step 2: Calculate Your Traffic-to-Lead Rate and Set a Baseline
Once you know which lead actions count, use the same date range and the same metric for both traffic and leads before you calculate anything.
Pull 30 to 90 Days of Visitor and Lead Data
Start with a recent, complete reporting period. Then apply that exact date range across every source you use. A full calendar month, like 07/01/2026–07/31/2026, is a solid choice for monthly reporting.
If your traffic is on the low side or your business has seasonal swings, use a 60- or 90-day window instead. That helps smooth out random bumps and gives you a steadier baseline.
Pick either sessions or users, then stick with that choice every month. Pull visitor data from your analytics platform. Then match it against lead totals from the same date range in your analytics and lead-tracking tools. That number becomes the baseline you’ll measure against month after month.
Run the Formula With a Simple Example
Using the same formula, your July 2026 rate is:
Say your site had 1,000 visitors in July 2026 and you recorded 45 leads from completed forms, tracked calls, quote requests, and confirmed bookings during that same window.
Math: (45 ÷ 1,000) × 100 = 4.5%
In U.S. reporting, you’d write it like this: "In July 2026, 4.5% of website visitors became leads." A 4.5% rate falls within the typical 2%–5% range for small business sites.
Save that figure as your baseline rate.
Break Out Baseline Rates by Lead Type
A single blended rate can hide what’s going on under the hood. With the same 1,000 visitors and 45 total leads, the mix might look like this:
Lead Type | Leads | Rate |
|---|---|---|
Contact forms | 20 | 2.0% |
Phone calls | 15 | 1.5% |
Quote requests | 5 | 0.5% |
Online bookings | 5 | 0.5% |
That table tells a clearer story. Quote requests and online bookings both sit at 0.5%, which puts those pages on your review list. When you split rates by lead type, it becomes much easier to spot weak points and track month-to-month shifts.
Step 3: Review Monthly Results and Read the Pattern
Once you have a baseline, compare each month against it to see what changed and why. Use the same monthly snapshot format every time so the differences are easy to spot.
Before you read the overall rate, split the numbers by lead type too.
Build a Simple Monthly Tracking Routine
Choose one fixed day each month - like the first business day - and spend 30 to 60 minutes updating two tables. The first table tracks your monthly totals: month, visitors, total leads, and traffic-to-lead rate. The second shows how those leads break down by action type. Stick with the same lead definitions every month so your baseline stays steady.
Start with the totals. Then use lead type to explain the shift.
Month | Visitors | Total Leads | Traffic-to-Lead Rate |
|---|---|---|---|
Baseline (07/2026) | 1,000 | 45 | 4.5% |
08/2026 | 1,100 | 44 | 4.0% |
Lead Type | Baseline | Current Month | Change |
|---|---|---|---|
Contact forms | 20 | 14 | -30% |
Phone calls | 15 | 20 | +33% |
Quote requests | 5 | 5 | 0% |
Online bookings | 5 | 5 | 0% |
In this example, the overall rate dropped from 4.5% to 4.0%. The second table shows why: form submissions fell, while calls went up.
How to Read Changes in Forms, Calls, Quote Requests, and Bookings
Each lead type points to a different kind of change.
More calls and fewer form submissions often means mobile visitors would rather tap a phone number than fill out a form. It can also mean the phone option is easier to see or use. Check whether your phone number stands out on mobile pages and whether your form asks for too much.
A drop in booking completions with steady traffic usually signals friction in the booking flow. Maybe the calendar is full. Maybe the time slots aren't clear. Maybe the scheduling page is harder to use than it looks at first glance. If bookings fell on just one service page, you're probably looking at a page-level issue, not a site-wide one.
More quote requests on a service page usually tells you the message got clearer. People understand the offer well enough to ask for pricing. When that happens, look closely at what changed on that page - maybe the headline, the service description, or the call to action - and use that lesson in other places.
Each monthly review should answer three things:
Did the overall rate move up or down compared with the baseline?
Which lead type changed the most?
Which page or traffic source helps explain that change?
Use the Gatsboy Dashboard and Booking Data for Monthly Reviews
If your dashboard already tracks forms and bookings in one place, use it for the monthly review. Gatsboy's business dashboard pulls form submissions and booking totals into a single view, so you don't have to bounce between tabs to build your monthly table.
The Online Bookings tool shows completed appointments directly. That makes it easier to spot a drop in booking completions and check whether availability or the scheduling flow is causing it.
Stripe Payments separates paid bookings from unpaid ones, which helps you see which leads show the strongest intent.
Conclusion: Turn Your Traffic-to-Lead Rate Into Better Website ROI
Once you have a baseline, use it every month.
Your traffic-to-lead rate matters most when you review it monthly as a simple check on what turns visitors into leads, not just how much traffic your site gets.
The math is simple. If your site had 2,000 visitors and 60 leads last month, your rate was 3.0%. If you clean up your forms, sharpen your calls to action, and add trust signals near your booking button so those same 2,000 visitors produce 100 leads, your rate climbs to 5.0%. That's 40 more leads from the same traffic.
A site converting at 1% generates 10 leads per 1,000 visitors. At 3%, that same traffic brings in 30 leads. That's a big difference, and it doesn't always take a bigger ad budget to get there. Optimizing essential website features can move the number:
A cleaner form
A more visible "Book Now" button
Reviews placed closer to your contact section
Gatsboy's business dashboard puts forms and Online Bookings in one place, which makes monthly reviews easier to read and compare. You can line up this month's results against your baseline and spot which lead action changed.
The point isn't to chase a perfect rate. It's to build a steady habit: keep your lead definition the same, use the same formula, and review it on the same date each month. Even a shift from 3.0% to 4.0% can lead to more inquiries and bookings.
FAQs
What’s a good traffic-to-lead rate for a small business website?
There’s no single conversion rate that fits every small business website. Results change based on your industry, where your traffic comes from, and what people want when they land on your site.
A better way to judge performance is to set your own baseline. Track key actions each month, such as form submissions, quote requests, and online bookings. Then use your Gatsboy dashboard to spot patterns and improve your calls to action over time.
Should I use users or sessions in my traffic-to-lead rate?
Yes. Using sessions is a solid way to measure your traffic-to-lead conversion rate.
A session represents a single visit or activity period on your site. That makes it useful for seeing how many visits turn into lead actions, like a form submission or booking request.
When you track this in your Gatsboy dashboard on a steady basis, you can set a baseline and compare month-to-month performance.
How long should I track data before trusting my baseline?
Track performance for at least 30 days so you have a solid baseline to work from. Looking at results month by month makes it easier to spot trends, see shifts in peak activity, and account for changes in customer behavior.
Using your Gatsboy dashboard with a past 30 days filter can give you a clearer picture of your usual traffic-to-lead rate and help you make better-informed decisions.
Related Blog Posts
Join our community of 15,000+ business owners
Popular articles
Popular articles about your website and marketing your small business

