


How to Track Competitor Social Media Engagement
Small Business Marketing
Tracking your competitors' social media engagement can help you understand what works in your industry, improve your content strategy, and uncover opportunities to stand out. Here's a quick summary:
Why Track Competitors? Gain insights into successful strategies, spot gaps, and make data-driven decisions.
Key Metrics to Watch: Engagement rate, response time, follower growth, content mix, and posting frequency.
Steps to Start:
Set clear goals, like improving brand awareness or identifying content gaps.
Identify 3–5 direct, indirect, or aspirational competitors.
Collect engagement data manually or use tools like Hootsuite or Metricool.
Analyze metrics to benchmark your performance and refine your strategy.
Turn insights into action by improving your content, response times, and workflow.
Tools to Simplify Tracking: Use built-in features like Facebook Pages to Watch or third-party tools for automation.
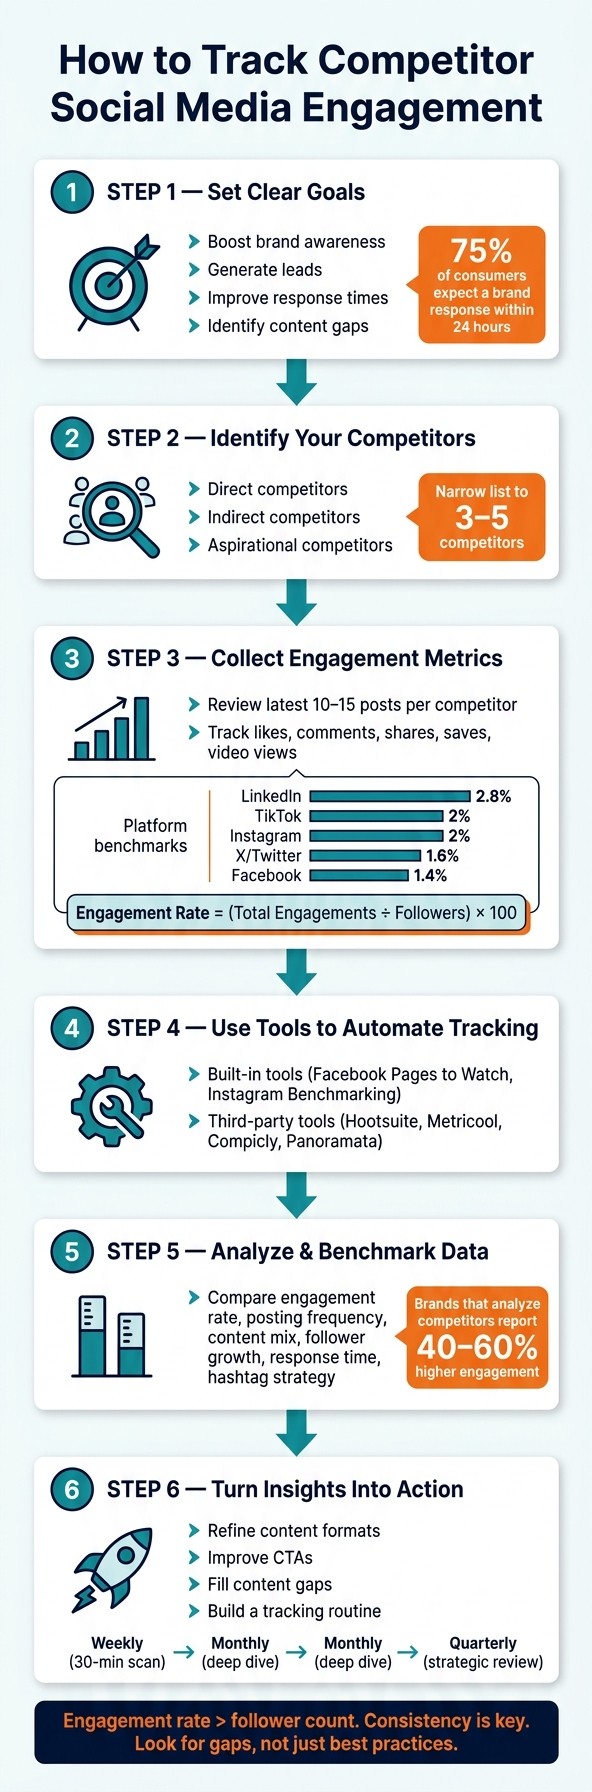
How to Track Competitor Social Media Engagement: 6-Step Framework
How To Make A Social Media Competitor Analysis 🔍 [+ FREE TEMPLATE]
Step 1: Set Clear Goals for Engagement Tracking
Before diving into competitor analysis, it’s crucial to define your tracking goals. Without a clear purpose, you risk gathering data that doesn’t serve your needs. Are you struggling to expand your audience? Losing customers to competitors? Unsure if your content strategy is hitting the mark? Each of these challenges calls for a specific tracking focus. By identifying your business hurdles, you can set clear objectives that guide your efforts.
Define Your Business Objectives
Here are common goals you might aim for:
Boosting brand awareness
Enhancing customer response times
Identifying content gaps that competitors haven’t addressed
For instance, if customer retention is your priority, pay attention to how quickly competitors reply to comments and direct messages. Why? Because nearly 75% of consumers expect a brand to respond within 24 hours.
To keep your efforts focused, set SMART goals - specific, measurable, and time-bound. For example: “Increase Instagram engagement by 15% within 90 days by leveraging insights from our top three competitors.” This approach provides a clear target to work toward.
Choose the Key Metrics to Focus On
Once your goals are set, focus on metrics that align with them. Trying to track everything can lead to overwhelming amounts of data and no actionable insights. One of the most insightful metrics is engagement rate, calculated as:
(Likes + Comments + Shares) / Followers × 100
This metric reveals how well your content resonates with your audience, going beyond surface-level popularity.
The specific metrics you track will depend on your objectives. Here’s a quick guide:
Goal | Metrics to Prioritize |
|---|---|
Grow brand awareness | Share of Voice, Follower Growth |
Improve content strategy | Content Mix, Engagements per Post |
Enhance customer care | Response Time, Comment Sentiment |
Identify content gaps | Posting Frequency, Topic Coverage |
For platforms like Instagram and TikTok, review competitor data weekly, as trends shift quickly. For slower-moving platforms like LinkedIn or Facebook, a bi-weekly review should suffice. This schedule ensures you stay updated without making tracking feel like a full-time job. By aligning your chosen metrics with your objectives, you’ll turn raw data into actionable insights that drive strategic growth.
Step 2: Identify Your Competitors
Now that your goals and metrics are in place, it’s time to pinpoint exactly who you’re tracking. A common mistake businesses make is either monitoring too many competitors or focusing on the wrong ones.
How to Find Competitors on Social Media
Start by breaking competitors into three categories:
Direct competitors: Offer the same product to the same audience.
Indirect competitors: Provide different products that address the same need.
Aspirational competitors: Industry leaders you aim to emulate.
For instance, a boutique fitness studio competes directly with nearby fitness studios, indirectly with home workout apps, and aspires to match the quality of a brand like Peloton.
Use 4–6 relevant keywords and hashtags to uncover competitors who frequently appear in your niche. Add hashtag searches to find brands driving conversations in your industry, even if they don’t rank for specific keywords.
"Social media competitive analysis demands a proactive approach because social media strategies don't work in a vacuum." - Sprout Social
Once you’ve compiled a broad list, narrow it down to 3–5 competitors. Tracking too many can make the data overwhelming and less actionable. Focus on brands that align closely with your target customer profile rather than those that are simply popular in your industry.
After identifying your competitors, it’s time to organize your findings.
How to Document Competitor Data
Create a simple tracking system, like a spreadsheet, to consistently capture and compare competitor information over time. At a minimum, include the following details for each brand:
Documentation Area | What to Record |
|---|---|
Profile Basics | Brand name, social handles, bio messaging |
Audience Data | Total follower count, net follower growth |
Activity Levels | Posting frequency, last post date, response time |
Content Mix | Video vs. photo ratio, promotional vs. educational split |
Engagement | Average likes/comments per post, top-performing hashtags |
Pay attention to subtler details like the tone of captions, visual style, and types of calls-to-action. These qualitative insights often highlight strategic opportunities that raw numbers alone can’t reveal. Businesses that regularly analyze competitors this way report 40–60% higher engagement, as they’re basing decisions on proven strategies rather than assumptions.
With a clear competitor profile in hand, you’re ready to dive into tracking engagement metrics in Step 3.
Step 3: Collect Engagement Metrics
Once you've documented your competitor list, it’s time to dig into the numbers from their profiles.
How to Track Metrics Directly on Platforms
Start by reviewing the latest 10–15 posts for each competitor on their active platforms. For each post, record metrics like likes, comments, shares, saves, and video views. To calculate the engagement rate, use this formula:
(Total Engagements ÷ Total Followers) × 100. For video posts, substitute video views for total engagements.
As a reference, a healthy engagement rate generally falls between 1% and 5% across most platforms. In 2026, the average engagement rates by platform are:
LinkedIn: 2.8%
TikTok: 2%
Instagram: 2%
X/Twitter: 1.6%
Facebook: 1.4%.
Beyond numbers, pay attention to qualitative elements like catchy captions, calls-to-action, and how quickly they respond to comments. These give insight into their strategies.
How to Organize Data in a Spreadsheet
To keep everything clear, set up a spreadsheet with rows for competitors and columns for key metrics, broken down by platform. Focus on the 2–3 platforms where your competitors are most active. Here’s a suggested layout:
Column | What to Record |
|---|---|
Competitor Name | Brand name and social handle |
Platform | Instagram, LinkedIn, TikTok, etc. |
Followers | Total follower count |
Posts Per Week | Average posting frequency |
Avg. Likes / Comments / Shares | Per-post averages from recent content |
Engagement Rate (%) | Use the formula above |
Top Content Format | Video, carousel, image, or text |
Notes | Observations like tone, CTAs, and response speed |
Include a date column to track trends over time. Plan to update the spreadsheet monthly for a comprehensive review, while doing quick weekly checks to spot any sudden changes in competitor activity. This approach keeps your data relevant without overwhelming your schedule.
"The engagement rate never lies." - Elena Cucu, Content & SEO Manager, Socialinsider
With your metrics well-organized and periodically updated, you’ll be ready to streamline data collection and move into deeper analysis in the next step.
Step 4: Use Tools to Automate Tracking
Manually keeping tabs on competitor profiles every week can quickly become a chore. Save time by using tools that automatically gather data, highlight trends, and reveal what’s working for your competitors.
Using Built-In Platform Features
Start with the tools already available on social platforms. For instance, Facebook Pages to Watch (accessible in Page Insights) lets you track specific competitor pages and compare metrics like follower growth and engagement over the past week - no extra setup needed. On the advertising side, the Facebook Ad Library is a free resource where you can see all active ads your competitors are running, complete with visuals, copy, and CTAs. Checking this monthly can help you identify patterns, such as when competitors ramp up holiday promotions.
"If you do this every month or quarterly, you begin to see patterns from your competitors... you can build a calendar and map that information against your own campaigns to see whether you should replicate, adapt, or anticipate your competitors' moves." - Adina Jipa, CMO and Co-founder, Socialinsider
Instagram also offers benchmarking tools for professional accounts, allowing you to compare your reach and engagement against similar profiles in your industry. These built-in features are a great, no-cost way to get started. When you’re ready for more detailed insights, third-party analytics tools can take your tracking to the next level.
Third-Party Analytics Tools
For a deeper dive into historical trends, cross-platform data, and automated alerts, third-party tools are a great option. Here’s a quick overview of some worth exploring:
Tool | Best For | Key Feature | Starting Price |
|---|---|---|---|
Hootsuite | AI-driven performance tracking | Monitors competitor mentions across blogs, podcasts, forums, and even AI tools like ChatGPT | Free trial; Standard plan: 5 competitors |
Metricool | All-in-one social management | Offers a "Forever Free" plan with full integrations | Free |
Compicly | Quick competitor insights | Generates reports with just a website link - no logins required | $29/month (Starter) |
Marketing benchmarks | Tracks changes to websites and landing pages over time | Free trial available |
For example, Hootsuite can monitor mentions of competitors across a vast range of platforms, including blogs and newsletters, giving you a much broader picture than social media alone.
"Numbers like engagement or follower growth tell only part of the story. The real value comes from understanding why those numbers look the way they do - what formats competitors use, how often they post, and which content pillars they lean on." - Adina Jipa, CMO and Co-founder, Socialinsider
Once you’ve set up automated tracking with these tools, you can use the insights to refine your online strategy and make data-driven decisions.
How Gatsboy Complements Social Insights
Competitor tracking isn’t just about improving your social media game - it can also boost your entire online presence. For instance, if you notice that certain services are driving high engagement for competitors (like lots of comments asking about pricing or availability), you can use Gatsboy's booking modules to emphasize those services on your site. Plus, with Stripe Payments integration, you can quickly launch promotions based on these insights - no technical headaches. The competitor data informs your strategy, while tools like Gatsboy make it easy to execute through your small business website.
Step 5: Analyze and Benchmark Engagement Data
Once you've collected the data, it's time to dive into the analysis. This step is all about making sense of the numbers and comparing them to uncover useful patterns that can guide your strategy.
How to Compare Metrics Across Competitors
Using the data you've gathered, shift your focus to assessing engagement metrics. The key here is to standardize your measurement approach. For example, a brand with 500,000 followers but only 1,000 likes per post is underperforming compared to a smaller brand with 10,000 followers earning 300 likes. This is why engagement rate is such a critical metric - it provides a fair comparison regardless of audience size.
In addition to engagement rate, evaluate these five key areas for each competitor:
Posting frequency
Content mix (e.g., video, image, carousel)
Follower growth
Response time
Hashtag strategy
These metrics go beyond surface-level popularity and give you a clearer picture of your competitors' operational strengths.
Another valuable angle is identifying content gaps - areas your competitors are neglecting. For instance, if no one in your industry is using Instagram carousels, consider experimenting with them. Carousels typically achieve 1.4x more reach on Instagram compared to other formats. Such gaps can highlight opportunities to differentiate your approach.
How to Build a Benchmarking Table
A benchmarking table is a simple yet powerful tool for comparing your performance against competitors. To keep the analysis manageable, focus on 3–5 competitors that closely align with your target audience. Use a table like this to organize the data:
Metric | Your Brand | Competitor A | Competitor B | Competitor C |
|---|---|---|---|---|
Engagement Rate (%) | ||||
Posts per Week | ||||
Content Mix (% Video) | ||||
Avg. Response Time | ||||
Monthly Follower Growth |
Update this table monthly to track trends and shifts over time. Brands that consistently analyze their competitors often see 40–60% higher engagement by refining their strategies based on data-backed insights. The goal isn't to mimic competitors but to understand the broader landscape and make well-informed decisions for your content.
Step 6: Turn Insights Into Action
How to Improve Your Social Media Content
Now’s the time to use those insights to fine-tune your content. Take a close look at your competitors' top-performing posts and pinpoint what makes them stand out. Are they using bold claims, eye-catching stats, or direct questions to hook their audience? If short-form videos dominate their feeds - and with platforms like Facebook, Instagram, and TikTok giving these formats the spotlight - it’s worth incorporating them into your strategy.
Also, pay close attention to their calls-to-action (CTAs). Do they encourage users to save posts, leave comments, or click links? Identify which CTAs are driving the most engagement, and adjust yours to match or improve on their approach. Another goldmine? Competitor comment sections. Look for repeated unanswered questions - they’re like neon signs pointing to content gaps you can fill. By refining your approach based on these observations, you’re not just analyzing - you’re actively improving.
How to Apply Insights to Your Business Workflow
The value of these insights doesn’t stop at content tweaks - they can enhance your entire workflow. For example, if competitors are slow to reply to comments or messages, you’ve got an opportunity to stand out. With nearly 75% of consumers expecting responses within 24 hours, prioritizing quick replies can give you a clear edge.
Competitor feedback can also guide optimizations for your website. If you notice recurring complaints about clunky booking systems or payment issues, use that knowledge to streamline your own processes. For small businesses using Gatsboy, tools built into the platform make it easier to address these pain points and turn insights from social listening into actionable improvements. By weaving these insights into your operations, you create a smoother customer experience and set the stage for steady growth.
How to Build a Routine for Ongoing Tracking
To make competitor analysis a long-term asset, consistency is key. A structured routine ensures you stay on top of changes in your industry. Here’s a simple three-tiered plan to keep you organized:
Review Frequency | Focus | Key Activities |
|---|---|---|
Weekly | Pattern detection | Spend 30 minutes scanning for high-performing posts and updating engagement metrics. |
Monthly | Deep dive | Analyze one competitor’s standout content and calculate their engagement rates. |
Quarterly | Strategic review | Look for shifts in positioning and emerging audience trends. |
"Structure beats sporadic observation - a simple weekly scan plus monthly deep dives surfaces more insight than occasional comprehensive analysis that never gets repeated." - Xpoz
Weekly reviews help you spot trends and flag standout posts quickly. Monthly deep dives let you dig into the details, while quarterly reviews focus on the bigger picture, like shifts in audience behavior or industry trends. Over time, this routine transforms competitor tracking from an occasional task into a powerful, ongoing strategy.
Conclusion: Key Takeaways for Tracking Competitor Engagement
Tracking competitor engagement on social media isn’t about imitation - it’s about understanding what resonates in your industry so you can improve your own strategy. The six steps outlined earlier provide a clear roadmap: set specific goals, pinpoint the right competitors, gather and organize metrics, leverage tools to streamline the process, benchmark your performance, and apply the insights you uncover.
The benefits are undeniable. Companies that consistently analyze their competition report 40–60% higher engagement rates by making data-driven adjustments. That’s not just a minor advantage - it’s the difference between working with guesswork and making informed decisions.
As you move forward, keep a few key points in mind. Engagement rates are more telling than follower counts. A competitor with 5,000 active, engaged followers can reveal more valuable insights than one with 50,000 disengaged ones. Focus on metrics that show efficiency and real interaction. Also, look for content gaps - topics competitors overlook, platforms they underutilize, or unanswered questions from their audience. These gaps are opportunities for you to stand out.
"The goal is not to copy, but to innovate where others are falling short." - Sprout Social
Finally, consistency is your best ally. A routine weekly check paired with a more thorough monthly review will uncover far more actionable insights than a one-time deep dive. Make competitor tracking a habit, and it will quickly become one of your most effective tools for long-term growth.
FAQs
How do I pick the right competitors to track?
To zero in on the right competitors, start by identifying those who share your target audience. These typically fall into three categories:
Direct competitors: Businesses offering products or services similar to yours.
Aspirational competitors: Brands you admire and aim to emulate.
Indirect competitors: Companies that serve overlapping audiences, even if their offerings differ from yours.
Dive into keyword research and industry reports to pinpoint these players. Once identified, examine their content strategies, social media activity, and how they engage with their audience. Keep your list dynamic - update it regularly to stay aligned with shifts in the market and emerging competitors.
What’s the best engagement rate formula to use across platforms?
The go-to formula for calculating engagement rate is: Engagement Rate = (Total Engagements / Followers) × 100. This method is straightforward and ideal for tracking performance over time. That said, different platforms may prioritize specific metrics - like saves on Instagram or watch time on TikTok. To get the most meaningful results, pick a formula that aligns with your objectives, whether you're focusing on audience interaction or evaluating content performance. Just be sure to use the same approach consistently for reliable data.
How often should I review competitor engagement data without wasting time?
To keep up with the competition, check their engagement data every few days, especially if they’re posting often. For a more thorough understanding, dive into a detailed analysis each month, while doing quicker weekly reviews to stay updated. Using AI tools to automate these checks can save time and help you stay on top of key trends without losing focus.
Related Blog Posts
Únete a nuestra comunidad de 15,000+ propietarios de negocios
Artículos populares
Artículos populares sobre su sitio web y la comercialización de su pequeña empresa


